






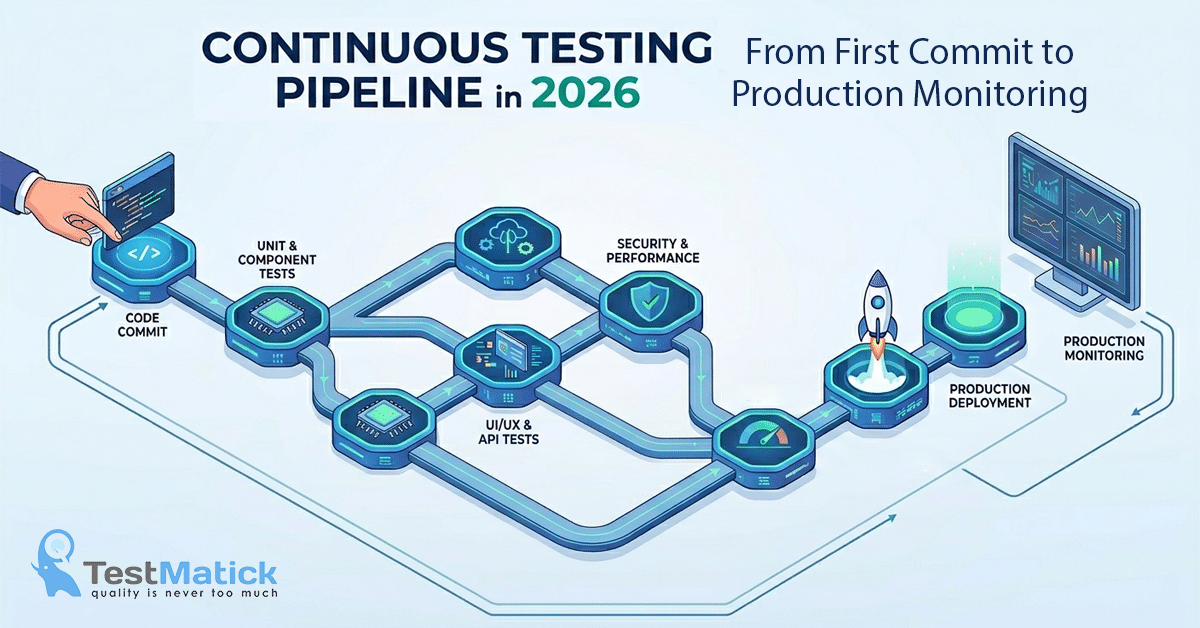
A practical guide to integrating testing into your CI/CD pipeline — from first commit to production
Most teams have a CI/CD pipeline. Fewer have a continuous testing pipeline.
The difference is significant. A CI/CD pipeline that deploys code without quality gates is a delivery mechanism. A continuous testing pipeline is a quality mechanism — one that catches bugs at the cheapest possible stage, enforces standards automatically, and gives teams the confidence to ship faster because they know what they’re shipping.
Building one doesn’t require a complete overhaul of your existing infrastructure. It requires adding the right testing layers at the right stages, with the right quality gates, and monitoring that tells you what’s happening in production after you ship.
This guide covers the testing pyramid, CI/CD tool selection, pipeline architecture, quality gates, shift-right monitoring, and a real pipeline example with working configuration code.
The DevOps testing pyramid
The testing pyramid is the foundational model for understanding where different types of tests belong in a continuous pipeline. The principle: tests at the bottom are fast, cheap, and numerous. Tests at the top are slow, expensive, and selective.
Unit tests — the base
Unit tests verify individual functions and components in isolation. They run in milliseconds, require no external dependencies, and should make up the majority of your test suite — typically 60-70% of total test count.
In a continuous pipeline: unit tests run on every commit, before anything else. If unit tests fail, the pipeline stops immediately. No point running slower tests against code that can’t pass the basics.
What they catch: logic errors, edge cases in business calculations, incorrect return values, null handling. What they miss: integration failures, UI regressions, performance issues.
Integration tests — the middle
Integration tests verify that components work correctly together — your application logic with your database, your API with external services, your microservices with each other. They’re slower than unit tests (seconds to minutes) and more complex to set up, but they catch a category of bugs that unit tests fundamentally cannot.
In a continuous pipeline: integration tests run after unit tests pass, typically on pull requests and before merging to main. They’re the quality gate between individual development work and the shared codebase.
What they catch: database query failures, API contract violations, incorrect data transformations, authentication failures across service boundaries. What they miss: full user journey failures, performance under load, production-specific configuration issues.
End-to-end tests — the top
End-to-end (E2E) tests verify complete user journeys through the full stack — from the UI through the application layer to the database and back. They’re the slowest and most expensive tests to run and maintain, which is why they should be the most selective.
In a continuous pipeline: E2E tests run on a subset of critical scenarios before every release. Running your full E2E suite on every commit is a common mistake — it slows pipelines to the point where developers start bypassing them. Run unit tests on every commit, integration tests on every PR, E2E tests on every release candidate.
What they catch: full user journey failures, cross-browser regressions, integration failures that integration tests missed, production-like environment issues.
The pyramid in practice
A well-structured test suite for a mid-size SaaS product might look like: 800 unit tests (run in 45 seconds), 150 integration tests (run in 8 minutes), 60 E2E tests (run in 22 minutes). Total pipeline time: under 35 minutes for a full run, under 10 minutes for the commit-level checks that run most frequently.
CI/CD tool selection
The right CI/CD tool depends on where your code lives, how complex your pipeline needs to be, and whether you want managed or self-hosted infrastructure. Here’s an honest comparison of the most common options:
| Tool | Best for | Setup complexity | Cost |
| GitHub Actions | GitHub-hosted repos, startups | Low | Free tier + usage |
| GitLab CI | GitLab users, self-hosted | Low-Medium | Free + paid tiers |
| Jenkins | Enterprise, complex pipelines | High | Free (self-hosted) |
| CircleCI | Fast setup, cloud-native | Low | Free tier + usage |
| Bitbucket Pipelines | Bitbucket users | Low | Included with Bitbucket |
GitHub Actions — the default for most teams
If your code is on GitHub, GitHub Actions is the path of least resistance. The YAML configuration lives in your repository, the setup is minimal, and the free tier covers most early-stage startups. Marketplace actions handle common tasks — installing dependencies, running tests, deploying artifacts — without custom scripting.
Limitations: vendor lock-in to GitHub, and the free tier has limits that larger teams hit. But for most startups and mid-size teams, it’s the right default.
Jenkins — the enterprise workhorse
Jenkins is the most flexible CI/CD tool available and the most complex to operate. It’s self-hosted, which means full control over infrastructure and no usage-based costs — and also means you’re responsible for installation, maintenance, upgrades, and security.
Jenkins makes sense when: your pipeline has complex requirements that hosted solutions can’t handle, you need to integrate with on-premise systems, or your organization has existing Jenkins expertise and infrastructure. For teams without dedicated DevOps engineers, Jenkins is usually more infrastructure than it’s worth.
GitLab CI and CircleCI
GitLab CI is the natural choice for GitLab users — it’s built in, well-integrated, and capable of handling complex pipelines without external tooling. CircleCI offers fast setup, good parallelization, and a generous free tier, making it a solid choice for teams that want something more capable than GitHub Actions without Jenkins complexity.
Building the pipeline: stage by stage
A continuous testing pipeline isn’t a single test run — it’s a sequence of stages, each with a specific purpose and quality gate. Here’s how to structure it:
Stage 1: Static analysis and linting
Before running any tests, run static analysis. Linting catches syntax errors and style violations in seconds. Static analysis tools (ESLint, SonarQube, Semgrep) catch security vulnerabilities, code complexity issues, and common bug patterns without executing the code.
This stage should run in under 2 minutes and fail fast. A linting failure is cheap to fix early and expensive to debug after deployment.
Stage 2: Unit tests
Run the full unit test suite. This is fast (under 2 minutes for most codebases) and should block the pipeline on any failure. A codebase with 800 unit tests running in 45 seconds has no excuse for skipping this gate.
Stage 3: Integration tests
Run integration tests against a fresh test environment — either a Docker-based local environment or a dedicated test infrastructure. This stage takes longer (5-15 minutes) and requires more setup, but it catches the integration failures that unit tests miss.
Key consideration: test data management. Integration tests need realistic data to be meaningful. Use database seeding scripts or factories to create consistent, isolated test data for each run. Never share test data between parallel test runs — it causes flakiness.
Stage 4: Security scanning
Automated security scanning should run in every pipeline. Tools like Snyk, Dependabot, or OWASP Dependency-Check scan your dependencies for known vulnerabilities. SAST (Static Application Security Testing) tools scan your code for security issues.
This doesn’t replace penetration testing or manual security review — it catches the known vulnerabilities that automated tools can find, which represent a significant portion of real-world security incidents.
Stage 5: E2E tests (pre-release only)
Run E2E tests against a staging environment that mirrors production. This stage is the most expensive — 15-30 minutes for a typical suite — which is why it runs on release candidates rather than every commit.
The staging environment matters. Tests that pass on a staging environment that doesn’t match production give false confidence. Invest in keeping staging and production in sync.
Stage 6: Performance benchmarks
Before deploying to production, run performance benchmarks against your critical endpoints. Response time regression — a deployment that makes your checkout endpoint 200ms slower — is a real production issue that functional tests won’t catch.
Tools: k6, Gatling, or Apache JMeter for load testing. Lighthouse CI for frontend performance. Set thresholds: if response time exceeds your baseline by more than 10%, fail the build.
Quality gates and deployment decisions
A quality gate is a threshold that determines whether a build proceeds to the next stage. Without quality gates, a pipeline is just a test runner — it reports results but doesn’t enforce standards.
Effective quality gates for a continuous testing pipeline:
- Unit test pass rate: 100%. No exceptions. A failing unit test is a broken build.
- Integration test pass rate: 100% for critical paths, configurable threshold for secondary tests.
- Code coverage: set a minimum threshold (typically 70-80%) and fail if coverage drops below it. Don’t chase 100% — chase meaningful coverage of the right code.
- Security vulnerabilities: fail on any critical or high severity finding. Configure acceptable thresholds for medium and low severity.
- Performance regression: fail if response time increases by more than an acceptable percentage (typically 10-15%) from the baseline.
- E2E test pass rate: 100% for smoke test scenarios. Configurable threshold for the full regression suite.
Quality gates should be version-controlled alongside your pipeline configuration. A gate that exists only in a UI dashboard gets forgotten, bypassed, or accidentally deleted.
Shift-right: monitoring in production
Continuous testing doesn’t end at deployment. Shift-right testing means extending quality practices into production — monitoring real user behavior, catching issues that tests missed, and feeding production data back into test design.
Synthetic monitoring
Synthetic monitoring runs scripted user journeys against your production environment on a schedule — every 5 minutes, every hour, whatever makes sense for your application. If a synthetic test fails, you know before your users do.
Tools: Datadog Synthetic Monitoring, Checkly, or a simple Playwright script running on a schedule. Focus on your most critical user journeys — registration, login, core product action, payment. These are the flows where downtime has immediate business impact.
Real user monitoring
Real User Monitoring (RUM) collects performance data from actual user sessions — page load times, API response times, JavaScript errors, and user interaction metrics. Unlike synthetic monitoring, it reflects real-world conditions: actual user devices, networks, and usage patterns.
Tools: Datadog RUM, New Relic, or open-source options like OpenTelemetry. The data feeds back into your testing strategy — if RUM shows that 15% of users on iOS 15 experience a specific JavaScript error, you know what device configuration to add to your test matrix.
Error tracking
Error tracking captures and aggregates production errors in real time. Every unhandled exception, every failed API call, every JavaScript error gets logged, grouped, and prioritized. This is how you find the bugs that your tests missed — and it should inform your next test writing session.
Tools: Sentry is the default recommendation for most teams. Rollbar and Bugsnag are solid alternatives. Integrate error tracking with your CI/CD pipeline so that a spike in production errors can trigger a deployment rollback automatically.
A real pipeline: working configuration
Here’s a production-ready GitHub Actions pipeline that implements all six stages described above. This configuration runs on every pull request and every push to main:
name: Continuous Testing Pipeline
on:
push:
branches: [ main ]
pull_request:
branches: [ main ]
jobs:
lint-and-static-analysis:
runs-on: ubuntu-latest
steps:
– uses: actions/checkout@v4
– uses: actions/setup-node@v4
with:
node-version: ’20’
cache: ‘npm’
– run: npm ci
– run: npm run lint
– run: npm run type-check
unit-tests:
needs: lint-and-static-analysis
runs-on: ubuntu-latest
steps:
– uses: actions/checkout@v4
– uses: actions/setup-node@v4
with:
node-version: ’20’
cache: ‘npm’
– run: npm ci
– run: npm run test:unit — –coverage
– uses: actions/upload-artifact@v4
with:
name: coverage-report
path: coverage/
integration-tests:
needs: unit-tests
runs-on: ubuntu-latest
services:
postgres:
image: postgres:15
env:
POSTGRES_PASSWORD: testpassword
POSTGRES_DB: testdb
options: >-
–health-cmd pg_isready
–health-interval 10s
steps:
– uses: actions/checkout@v4
– uses: actions/setup-node@v4
with:
node-version: ’20’
cache: ‘npm’
– run: npm ci
– run: npm run db:migrate:test
– run: npm run test:integration
security-scan:
needs: unit-tests
runs-on: ubuntu-latest
steps:
– uses: actions/checkout@v4
– run: npm audit –audit-level=high
e2e-tests:
needs: [integration-tests, security-scan]
if: github.ref == ‘refs/heads/main’
runs-on: ubuntu-latest
steps:
– uses: actions/checkout@v4
– uses: actions/setup-node@v4
with:
node-version: ’20’
cache: ‘npm’
– run: npm ci
– run: npx playwright install –with-deps
– run: npm run test:e2e
env:
BASE_URL: ${{ secrets.STAGING_URL }}
– uses: actions/upload-artifact@v4
if: failure()
with:
name: playwright-report
path: playwright-report/
Key design decisions in this configuration: each stage depends on the previous one passing (the ‘needs’ keyword), E2E tests only run on pushes to main (not on every PR), the database spins up as a service container for integration tests, and debugging reports only upload on failure to minimize storage costs.
Common continuous testing pipeline mistakes
Running everything on every commit
The most common pipeline mistake. A suite that takes 45 minutes to run on every commit will get bypassed within weeks. Developers stop waiting for results, start merging without green builds, and the pipeline loses its purpose. Structure tests by frequency: fast checks on every commit, slower checks on pull requests, E2E on release candidates only.
Treating staging as optional
E2E tests that run against a development environment don’t tell you anything about production behavior. Staging environments that differ significantly from production — different infrastructure, different data volumes, different third-party integrations — produce false confidence. Invest in keeping staging and production in sync. The cost of a diverged staging environment is measured in production incidents.
No ownership of flaky tests
Flaky tests — tests that fail randomly without a code change — are pipeline poison. Teams get used to seeing failures, start clicking ‘retry’ automatically, and eventually stop investigating failures altogether. The policy should be simple: a test that fails twice without a code change gets quarantined immediately and fixed before re-entering the pipeline.
Skipping the feedback loop
A pipeline that reports failures but doesn’t notify the right people at the right time is incomplete. Integrate pipeline results with Slack, email, or whatever communication tool your team uses. A failed build should surface immediately to the developer who caused it — not get discovered hours later during a release review.
How to build a continuous testing pipeline: step by step
Here’s the practical sequence for teams building a pipeline from scratch or improving an existing one:
Step 1: Audit your current state
Document what tests exist, where they run, and what they cover. Most teams discover gaps they didn’t know about. A test suite that exists but doesn’t run in CI is not a continuous testing pipeline.
Step 2: Choose your CI/CD tool
GitHub Actions for GitHub repos. GitLab CI for GitLab. CircleCI for teams wanting fast setup without GitHub lock-in. Jenkins only if you have existing infrastructure and DevOps expertise.
Step 3: Start with unit tests in CI
If you have unit tests that don’t run in CI, fix that first. This is the highest ROI improvement available — fast, cheap, and immediately catches regressions.
Step 4: Add integration tests
Set up test database infrastructure, write database seeding scripts, and add integration tests to the pipeline. This stage catches the failures that unit tests miss and is worth the setup investment.
Step 5: Add quality gates
Define and enforce thresholds for test pass rate, code coverage, and security vulnerabilities. A pipeline without quality gates is just a test reporter.
Step 6: Add E2E tests for release candidates
Run E2E tests on your staging environment before every production deployment. Start with 10-15 critical scenarios and expand coverage over time.
Step 7: Set up production monitoring
Add error tracking (Sentry), synthetic monitoring for critical flows, and real user monitoring for performance. The pipeline doesn’t end at deployment.
Frequently Asked Questions
How long does it take to build a continuous testing pipeline from scratch?
For a team with existing tests but no CI/CD pipeline: 1-2 weeks to get unit and integration tests running automatically. For a team starting from zero tests: 4-8 weeks to build meaningful coverage and a working pipeline. The pipeline configuration itself is fast — the test writing takes time.
What’s the biggest mistake teams make with CI/CD pipelines?
Running everything on every commit. A pipeline that takes 45 minutes to run will get bypassed. Structure your pipeline so that fast checks (linting, unit tests) run on every commit, slower checks (integration, E2E) run on pull requests and releases. Keep the commit-level feedback loop under 5 minutes.
Do we need a staging environment for continuous testing?
Yes — for E2E tests and pre-release checks. Unit and integration tests can run against ephemeral test environments (Docker containers, in-memory databases) without a persistent staging environment. But E2E tests need an environment that mirrors production, or the results don’t reflect production behavior.
How do we handle flaky tests in a CI pipeline?
Quarantine them immediately. A flaky test — one that fails randomly without a code change — is worse than no test. It creates alarm fatigue, trains developers to ignore failures, and eventually masks real bugs. Move flaky tests to a separate suite that runs outside the deployment gate while you investigate and fix the root cause.
Want to optimize your testing pipeline?
Slow pipelines get bypassed. Flaky tests get ignored. Staging environments drift from production. These aren’t configuration problems — they’re process problems.
TestMatick has helped engineering teams across fintech, healthcare, and SaaS build pipelines that developers actually trust.
Contact TestMatick to learn how we can help your team ship better software. testmatick.com
-> Optimize Your Pipeline — testmatick.com


0 Comments